The first task is to classify what happened during the call.
Identify the exact symptom
Record whether you experienced:
- frozen incoming video;
- other people unable to hear you;
- robotic or broken audio;
- a “connection unstable” warning;
- the meeting application reconnecting;
- every internet application failing;
- only screen sharing failing;
- high CPU use or a slow Mac without other network symptoms.
Different symptoms point to different tests. “The call was bad” is not enough to distinguish an outage from degraded media quality.
Check whether the whole internet connection failed
During the problem, immediately test another service:
- open a new website that is not already cached;
- send a message through another service;
- test from a second device on the same Wi-Fi;
- ping the router and a public address in separate Terminal windows.
Public test:
ping 1.1.1.1Find the router address:
route -n get default | awk '/gateway:/{print $2}'Then ping the returned gateway in another window.
If every service and several devices fail at the same time, a broader connection interruption is plausible. If only the meeting app degrades, inspect its statistics before assuming the ISP went down.
View Zoom meeting statistics
In the Zoom desktop app, Zoom provides meeting diagnostic statistics.
During a meeting:
- Click the upward arrow next to Start Video or Stop Video.
- Choose Video Settings.
- Open Statistics.
From the main app window, you can also open your profile picture, choose Settings, and select Statistics.
Review the relevant Audio, Video, and Screen Sharing tabs. Depending on the current client, available fields can include latency, jitter, packet loss, resolution, frame rate, and bandwidth.
View Microsoft Teams Call health
During a Teams meeting or call:
- Select More actions in the meeting controls.
- Open Settings.
- Select Call health.
Teams Call health exposes real-time information about the network, audio, outgoing video, and screen sharing. Network metrics include round-trip time and received packet loss. Microsoft notes that low frame rate can also reflect computer performance rather than only network quality.
Understand latency, jitter, and packet loss
These measurements describe different problems:
| Metric | Meaning during a call | Typical symptom when poor |
|---|---|---|
| Latency / round-trip time | Delay between endpoints or the service | Conversation delay and people speaking over each other |
| Jitter | Variation in packet arrival timing | Uneven, robotic, or broken audio |
| Packet loss | Media packets that never arrive | Missing audio, frozen video, or artifacts |
| Bitrate | Media data sent or received per second | Reduced quality when constrained |
Do not interpret one number without context. Call applications adapt quality, and a low frame rate may reflect the Mac's CPU/GPU workload or the content being sent.
Check the upload side, not only download speed
Video calls continuously send microphone, camera, and screen-sharing data. A connection can have fast downloads while uploads are congested or unstable.
During a test call:
- pause cloud backup or large uploads;
- stop unnecessary screen sharing;
- compare video on and off;
- avoid changing several conditions simultaneously;
- note whether another household device is uploading heavily.
An improvement is a clue, not final proof. Repeat the comparison under similar conditions.
Compare Wi-Fi, Ethernet, and another location
Run controlled comparisons:
- same Mac over Wi-Fi and Ethernet;
- same Mac near and far from the access point;
- same call application on another network or phone hotspot;
- VPN connected and disconnected, if policy allows;
- another device on the same local network.
Interpret carefully:
- Ethernet stable while Wi-Fi fails suggests the wireless path.
- Several devices failing together suggests a shared network or upstream problem.
- Only one Mac failing on several networks suggests the Mac, application, or software path.
- Only Zoom or only Teams failing may indicate an application/service-specific issue.
Correlate the call problem with an independent outage history
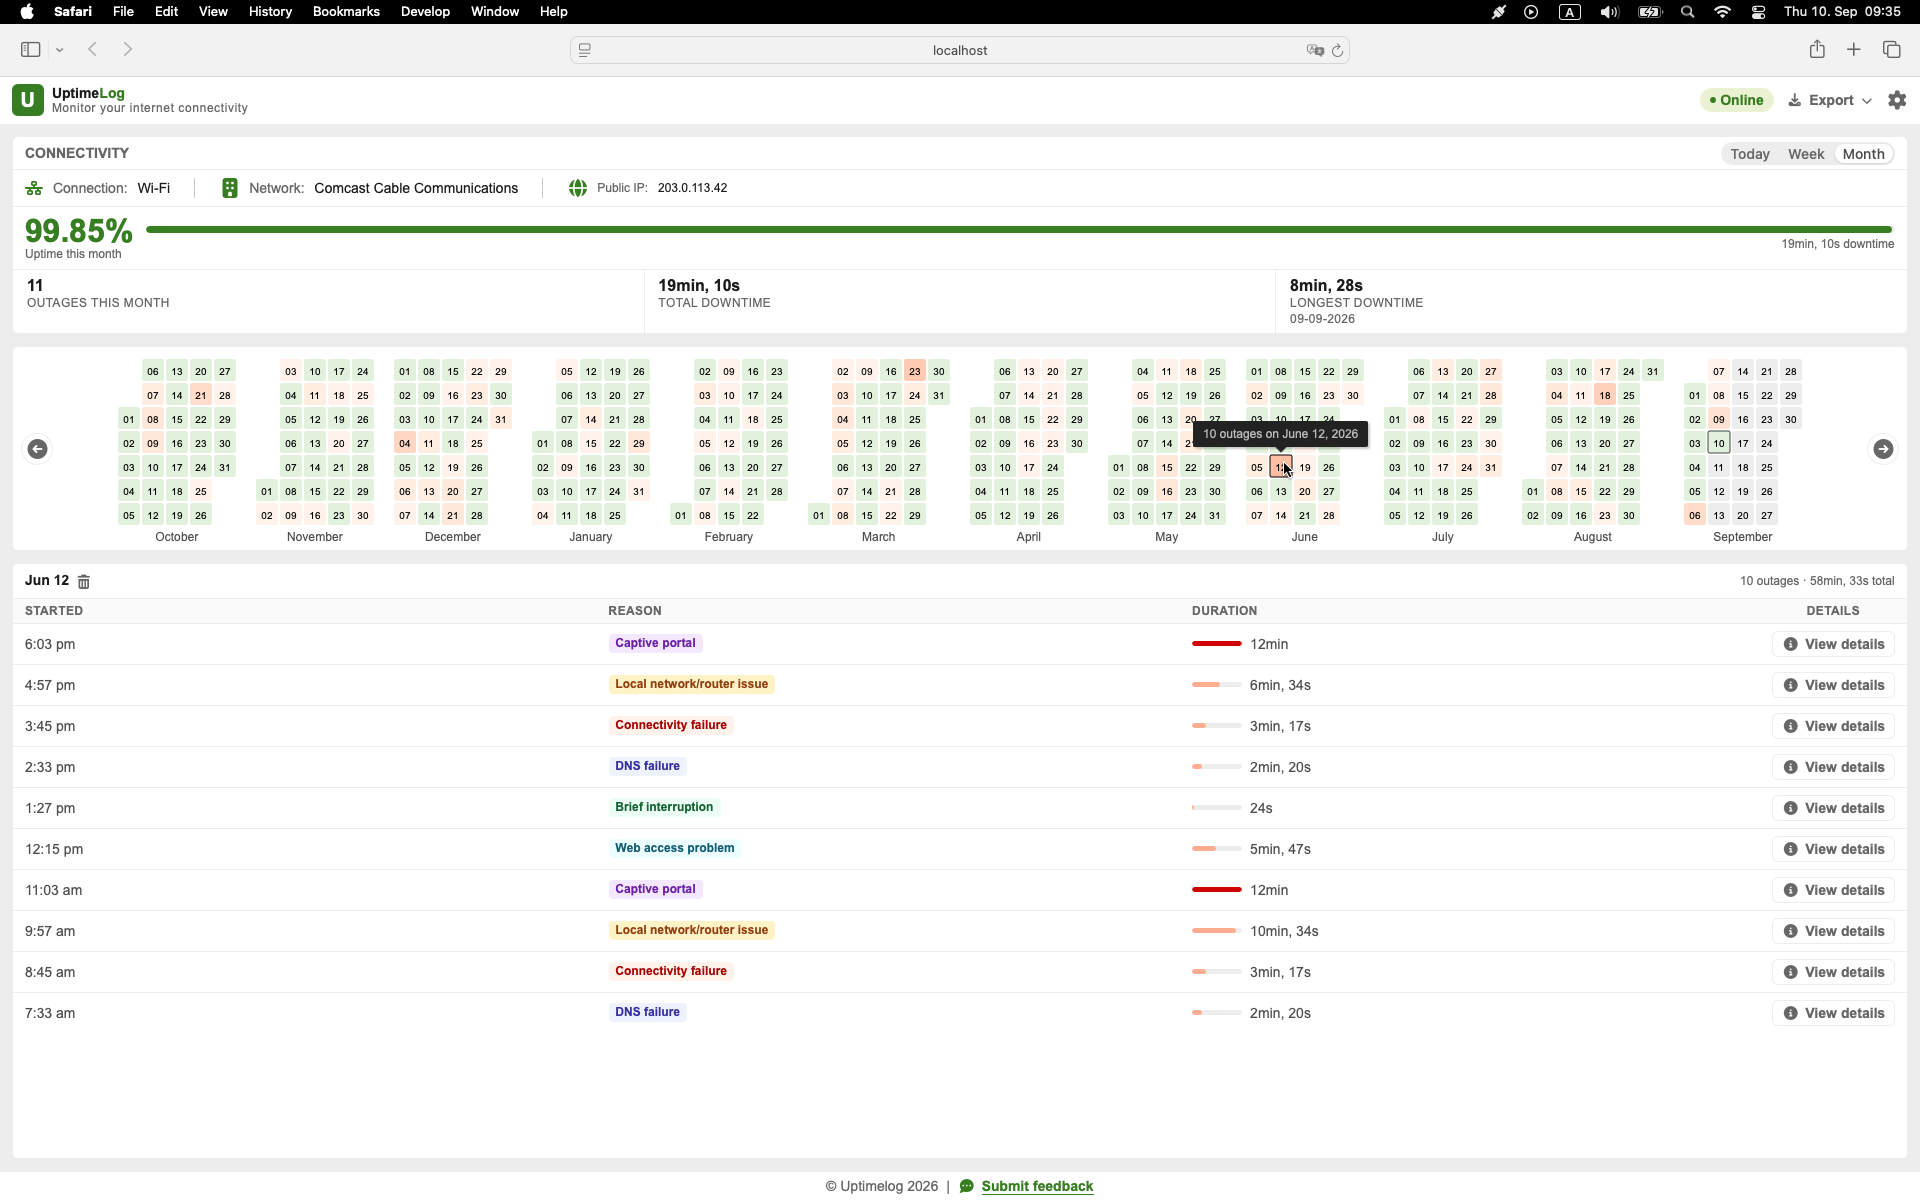
Call statistics describe media quality inside the application. An independent connectivity history answers a different question: did the Mac observe a broader internet interruption at the same time?
UptimeLog runs in the background on a Mac and records detected internet interruptions with start time, duration, recovery time, and connection details.
If UptimeLog records an outage at 10:14:22 and the call reconnects at the same time, the events are correlated. That still does not prove the ISP caused the outage, but it shows the symptom extended beyond subjective call quality.
If the call performs badly without a recorded connectivity outage, focus on latency, jitter, packet loss, Wi-Fi quality, upload congestion, application behavior, or computer performance.
Keep a short call-incident log
For each affected call, record:
- date, exact time, and time zone;
- Zoom or Teams;
- symptom and duration;
- wired or Wi-Fi connection;
- VPN state;
- call statistics near the event;
- whether other services failed;
- whether another device was affected;
- matching UptimeLog event, if present;
- controlled change tested afterward.
After several calls, patterns become visible: only screen sharing, only evening calls, only Wi-Fi, only one meeting service, or full internet outages across applications.
What each result suggests
| Observation | Next area to investigate |
|---|---|
| Full outage recorded; other devices fail | Router, modem, ISP, or common network path |
| Router fails with public target | Local Wi-Fi/Ethernet/router path |
| Router works; public target fails | Upstream connection or public route |
| No full outage; call shows packet loss/jitter | Wi-Fi quality, congestion, VPN, or media path |
| Only screen sharing fails | Upload capacity, app settings, or computer load |
| Only one app fails | App/service configuration or service incident |
| Mac struggles and frame rate falls | CPU/GPU load or device performance may contribute |
The table is a starting point. Repeat tests before treating one observation as the cause.
Start monitoring before the next call
Run the meeting application's statistics and an independent connection monitor before the problem occurs. That gives you two complementary records when the call fails.
UptimeLog includes free basic monitoring and five days of history. Pro is a $19 one-time purchase and adds full history, PDF reports, and CSV export.
macOS 12+ · Notarized by Apple · Free basic monitoring