UptimeLog User Manual
Overview of how to install, setup and work with the application.
- Overview
- Installation/Uninstallation
- Start
- Calendar Heatmap
- Logs
- Connection Status
- Settings
- Export Logs
Overview
UptimeLog is a macOS tool that provides continuous monitoring of your internet connection, displaying the current status and logging it in a textual format. It also presents the data on a calendar heatmap, allowing for a clearer understanding of patterns related to internet disconnections. This helps distinguish between brief, random connectivity losses and prolonged outages caused by your internet service provider (ISP).
Installation/Uninstallation
UptimeLog is distributed as a standard DMG package for macOS, which can be downloaded directly rather than through the App Store. Once the installation file is downloaded, simply double-click on it and drag the application to the Applications folder. To uninstall UptimeLog, just drag the app from the Applications folder to the Trash.
Start
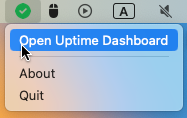
After successfully installing UptimeLog, launch the application and observe the icon in the menu bar. The icon reflects the current status of your internet connection.


To access the dashboard providing an overview of internet connection status, click on the UptimeLog menu bar icon and select 'Open Dashboard' This will launch your web browser and display the dashboard.
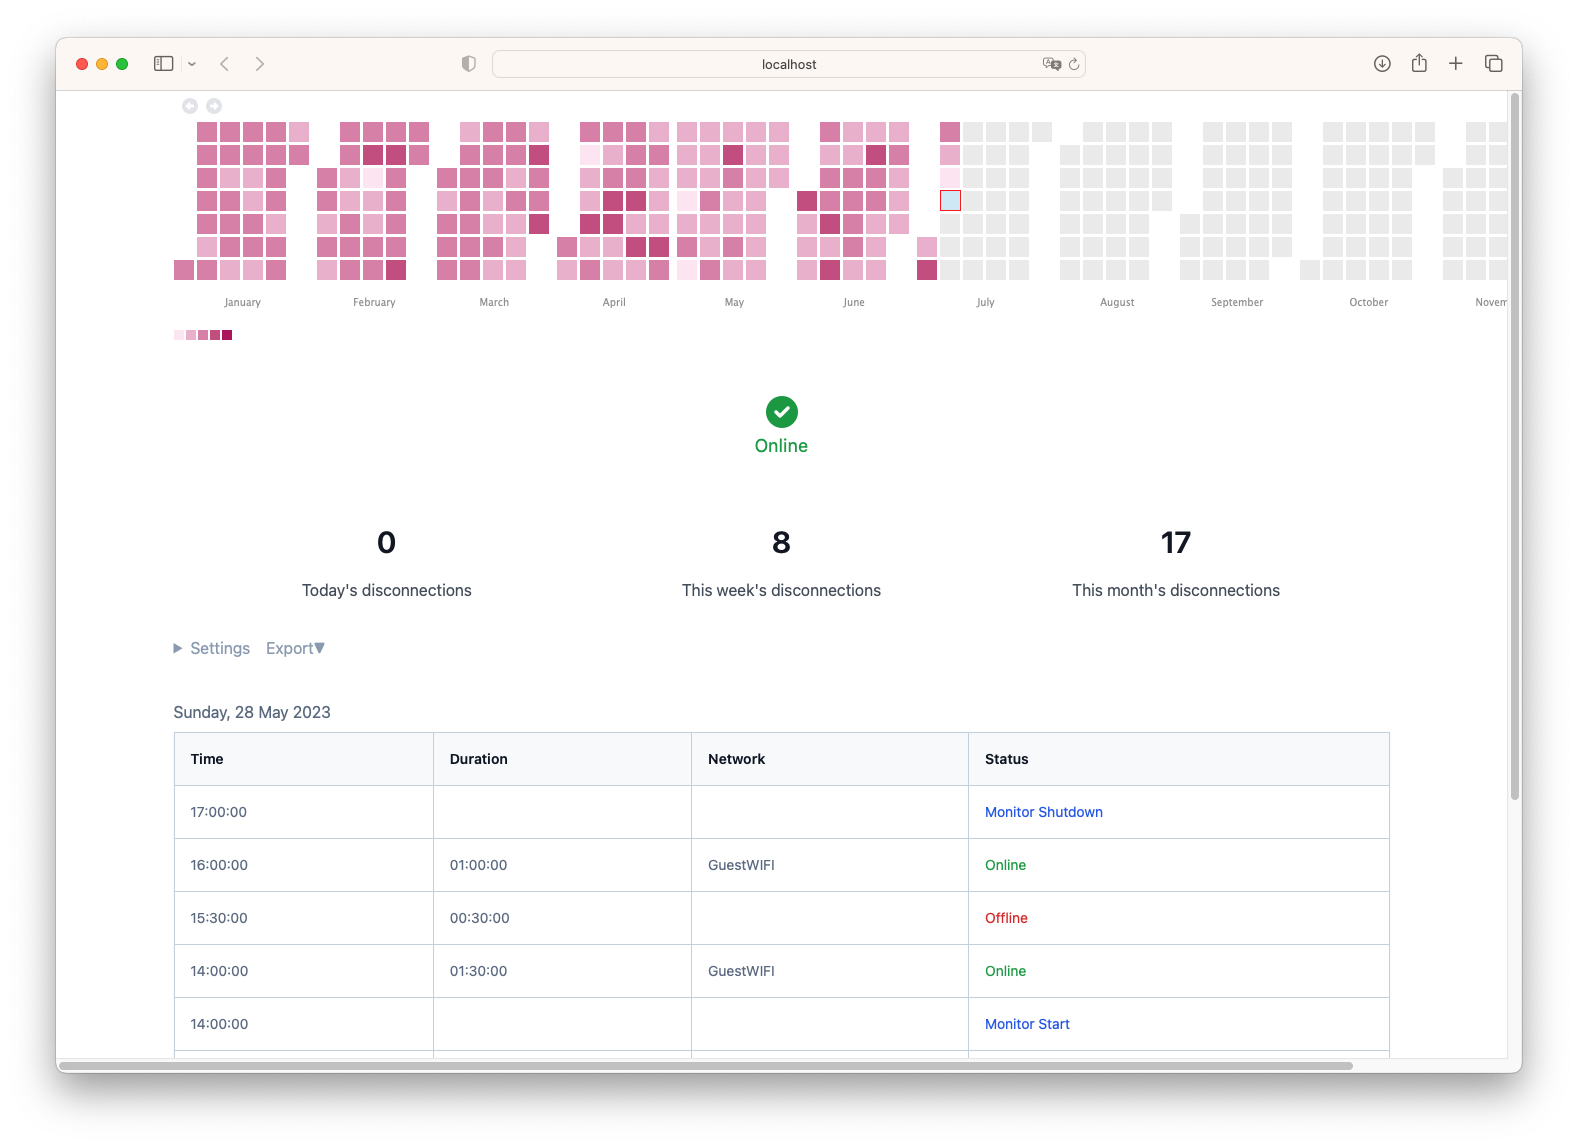
Calendar Heatmap
The calendar heatmap provides a visual representation of internet connection quality over time. The intensity of the red color indicates the number of internet connection interruptions on a given day, allowing for easy identification of dates and patterns with the highest occurrence of disruptions.
By hovering the mouse over a calendar cell, a tooltip popup displays the number of internet disconnections for that day. For a more detailed view of the number of disconnections on a specific day, simply click on a calendar cell, and all logged events for that day will be shown in a Log widget.

Logs
The Logs widget displays four types of events:
- Monitor Start: Indicates when the application is launched.
- Monitor Shutdown: Indicates when the application is closed.
- Online: Represents the availability of an internet connection.
- Offline: Represents the unavailability of an internet connection, indicating issues in reaching the pre-configured list of servers.
The Online and Offline events include mandatory fields such as Time, as well as a Duration field indicating the duration of the event.
The Online event includes an additional field called Network, which represents the Network Interface Name and Wi-Fi SSID (Wi-Fi network name) if a wireless connection is being used.

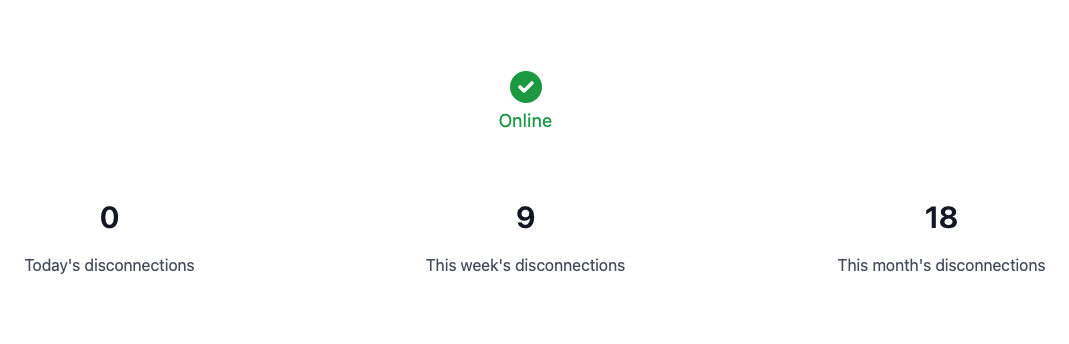
Connection Status
The Connection Status widget displays the current availability of the internet connection. This status is shown both in the Dashboard and the menu bar. Additionally, the Logs widget provides information on the most recent event and the current duration of that event.

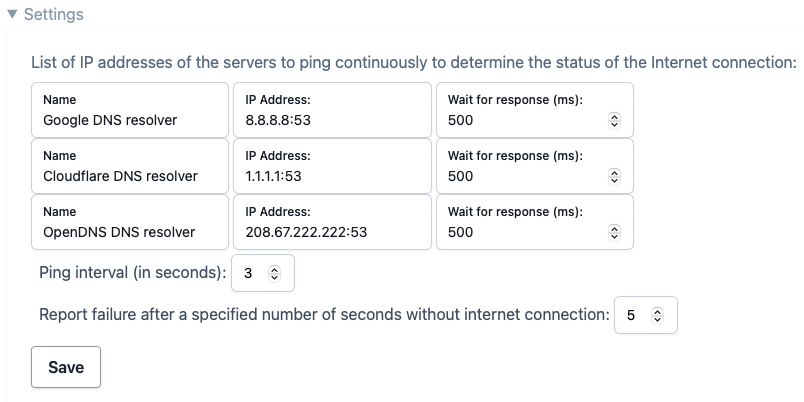
Settings
The Settings widget encompasses various options for determining internet connection availability. These options include configuring a list of IP addresses for server pinging, specifying response timeout duration, setting the interval between pings, and more. By default, the list of ping servers consists of well-known companies that are expected to be consistently available, serving as reliable indicators of internet connection presence.
Export Logs
The Logs widget provides a comprehensive overview of Online/Offline internet connection events based on the time of day. However, there is an additional option to export the logs to CSV format, allowing for manual or automated analysis. To export the logs as a CSV file, simply click on the 'Export -> CSV format' button, and the CSV file will be saved in the web browser's Download folder.